Normal Testosterone Levels by Age: What the Chart Hides
Short answer
Normal testosterone levels are percentiles of whichever men a laboratory happened to sample, not a standard of health. The most carefully built range runs from 264 to 916 ng/dL — and it describes men aged 19 to 39. The guideline states plainly that definitive age-specific ranges do not exist.
Almost every man who searches this phrase is holding a piece of paper. On it there is one figure and, beside it in smaller type, two more that mark out a range. If the figure sits inside the range there is a quiet sense of having been let off, and if it sits outside there is a jolt. Both reactions treat that printed range as though it meant something fixed.
It does not, and the reason is not a scandal. It is arithmetic. A reference range is a description of a group of people who were measured, using a particular machine, and both halves of that sentence move. This article is about how much they move, and what to do about it when the number in front of you is your own.
We earn nothing from any of this. There are no affiliate links on this site, nothing here is sponsored, and we do not sell tests or treatments, which is why this page can tell you that the reassuring range beside your result may have been drawn around a population that has nothing to do with you.
A reference range describes a sample, not a standard of health
Start with how the two numbers beside your result were produced. A laboratory measures a group of men, arranges the results from lowest to highest, and cuts off a slice at each end. What is left in the middle becomes “normal”.
The AUA guideline describes the convention exactly: reference laboratories often define a normal value as ranging within the 5th, or 2.5th, and 95th, or 97.5th, percentiles of a sampled population. Nothing in that procedure asks whether the men in the sample were well. It asks only where they fell relative to each other.
If the sampled population is broadly unwell, the range moves down with it, and a result that would have been flagged in a healthier sample is printed as ordinary. A percentile says where you stand in a queue. It does not say whether the queue is in good shape.
The most careful numbers, and the men they came from
The best answer available to the question “what is normal” came out of a deliberate attempt to fix the problem above. Researchers pooled 9,054 community-dwelling men from four cohort studies — the Framingham Heart Study, the European Male Aging Study, the Osteoporotic Fractures in Men Study, and the Male Sibling Study of Osteoporosis — across the United States and Europe.
A hundred participants from each cohort were re-measured using a reference method at the Centers for Disease Control and Prevention, and the results were used to convert every cohort's figures onto a single common scale. Only then were the percentiles calculated.
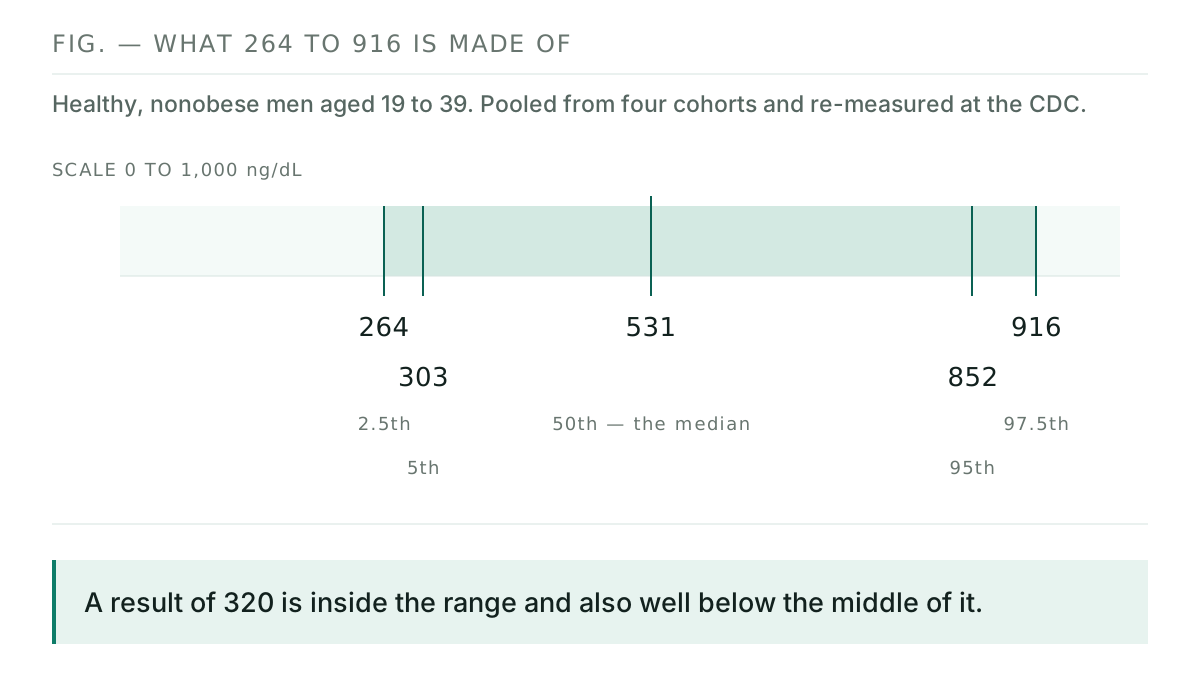
In healthy nonobese men aged 19 to 39, the harmonised 2.5th, 5th, 50th, 95th and 97.5th percentile values were 264, 303, 531, 852 and 916 ng/dL. The authors concluded that the harmonised normal range for that group is 264 to 916 ng/dL. Travison et al., Journal of Clinical Endocrinology & Metabolism, 2017
The middle figure is the one nobody quotes and the one worth remembering. The median healthy young man in that pooled population sat at 531 ng/dL. A result of 320 is inside the range and also well below the middle of it, and those two facts are both true at once.
Two words in that sentence are doing a great deal of work
“Healthy” and “nonobese” are not decoration. The same paper reports that age-specific concentrations in nonobese men were similar across the four cohorts and greater than in all men taken together. Restricting the sample raised the numbers.
That is the practical difference between a range built to describe health and a range built to describe attendance. The men in a commercial laboratory's sample are, by definition, men who had blood taken — which is not a random slice of the population and is not a healthy one.
It also explains why the same man can be told two different things by two different pieces of paper without either being fraudulent. He is being compared against two different crowds.
Definitive age-specific reference ranges do not exist
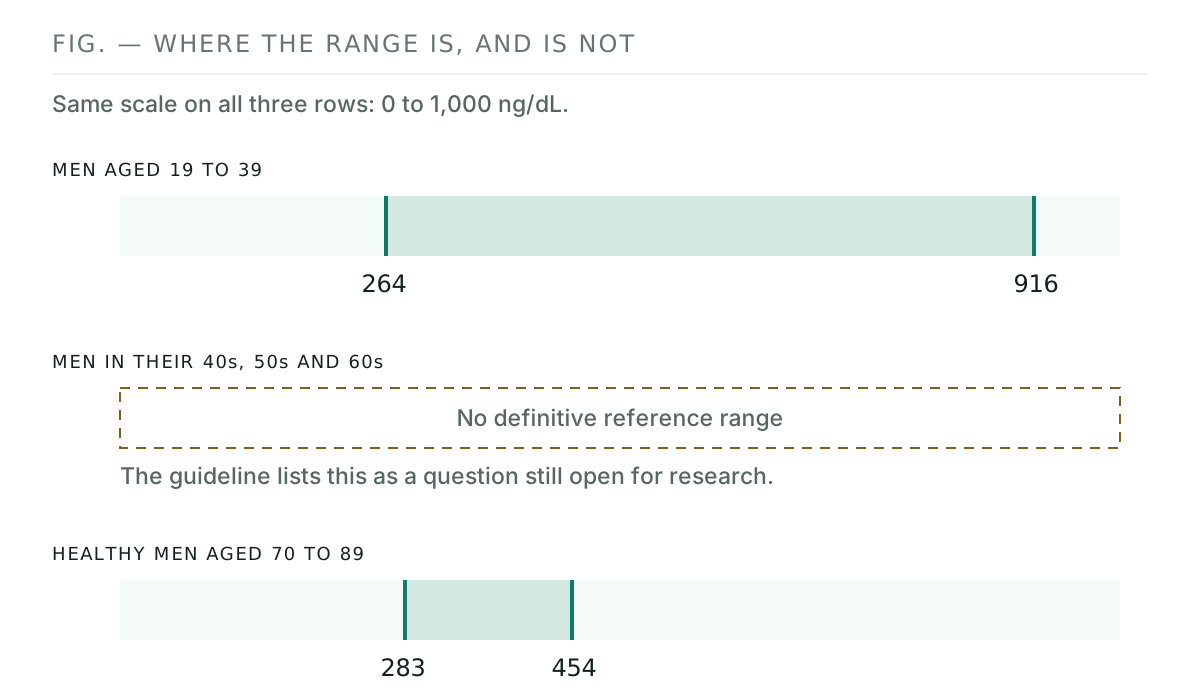
This is the sentence that most “levels by age” tables are quietly built on top of. The AUA guideline says it directly: while definitive age-specific reference ranges do not exist, some data suggest that patient age may play a role in setting therapeutic ranges, at least in the elderly population.
It repeats the point in its own list of open research questions, which begins by asking whether there are age-specific reference ranges for testosterone at all, and says the question should be answered for both total and free testosterone using specific methods. When a guideline lists something as future research, that is the honest state of the evidence.
The exception it does cite is instructive. A community-dwelling study of 3,690 healthy men aged 70 to 89 in Perth, Australia established a reference range of 283 to 454 ng/dL, with a mean of 361. Compare that with 264 to 916 in men aged 19 to 39 and the shape of the change becomes visible: the top of the range falls a great deal further than the bottom of it does.
| Population | Range reported | Where it comes from |
|---|---|---|
| Healthy nonobese men, 19–39 | 264–916 ng/dL (median 531) | Four pooled cohorts, 9,054 men, CDC reference method |
| Healthy men, 70–89 | 283–454 ng/dL (mean 361) | Community study of 3,690 men, Perth, Australia |
| Men in their 40s, 50s and 60s | No definitive range | Listed by the AUA as an open research question |
| Diagnostic cut-off used in practice | Below 300 ng/dL | AUA statement 1, in support of a diagnosis, with symptoms |
So a chart that hands you a tidy figure for “men in their fifties” is doing something the guideline says cannot yet be done definitively. That does not make the chart malicious. It makes it more confident than its evidence.
What ageing subtracts, measured in the same men over years
There is a better way to ask the age question than comparing different men of different ages, and it was done. The Baltimore Longitudinal Study of Aging measured testosterone in stored samples from 890 men and followed them, so the comparison is within the same man over time rather than between one man and another.
Using a mixed-effects model, the authors found significant, independent, age-invariant longitudinal effects of age on both total testosterone and the free testosterone index, with an average change of 0.124 nmol/L per year. In the units American laboratories print, that is roughly 3.6 ng/dL a year. Harman et al., Journal of Clinical Endocrinology & Metabolism, 2001
The same study reported how often that adds up to something a clinician would call low. Using total testosterone criteria, the incidence of hypogonadal levels rose to about 20 per cent of men over 60, 30 per cent over 70 and 50 per cent over 80. It also found that levels decreased with increasing body mass index, which is the thread running through this whole article.
Two things follow from that rate of change. The first is that a single year is a small signal, which is why a comparison against an old result is often more informative than a comparison against a printed range. The second is that a large drop over a short period is not the ordinary arithmetic of ageing and deserves a different question.
Why a laboratory can print 250 as normal
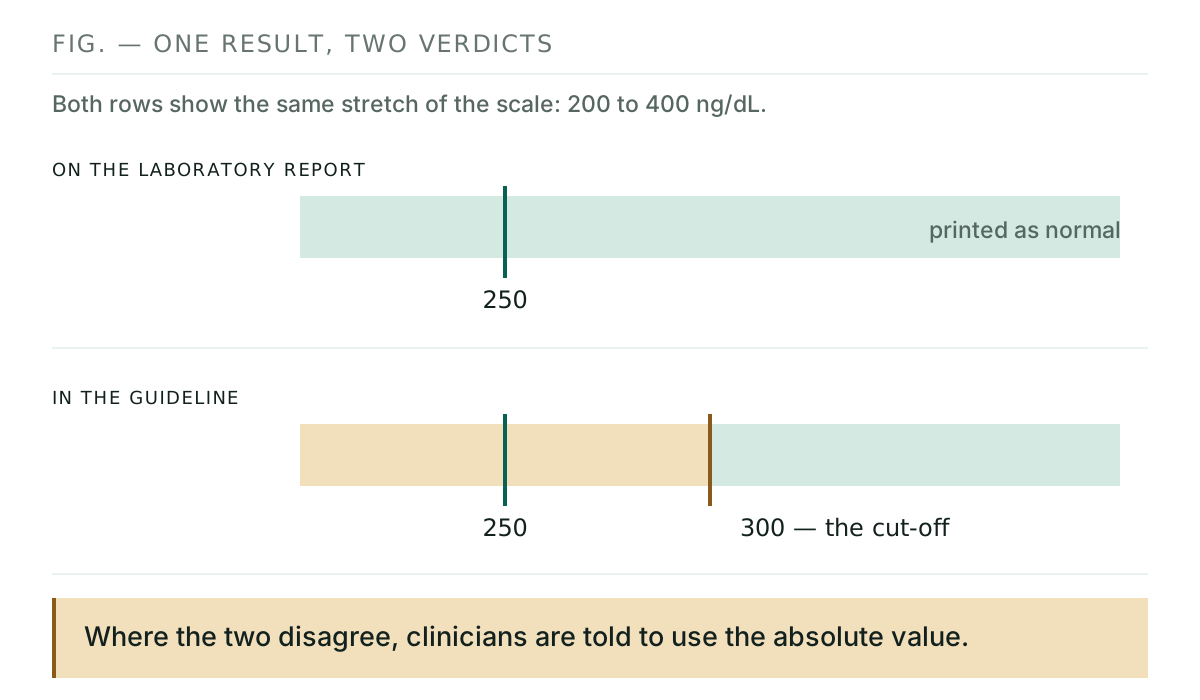
The guideline anticipates the confrontation between its own cut-off and the range on your report, and it uses a specific number to do it. A total testosterone value of 250 ng/dL, it says, may be considered low based on the guideline but be marked within the normal range by the laboratory.
Its instruction in that situation is unambiguous. Because the testosterone literature uses absolute values to define low testosterone, the absolute value is the most important factor, and in cases of discrepancy between laboratory reference ranges and the guideline, clinicians are recommended to use the absolute value — with the understanding that all laboratories carry some degree of variability.
This is the single most useful thing on this page. If your result is between roughly 250 and 300 and came back unflagged, you have not been told that the level is fine. You have been told where it sits relative to whoever that laboratory measured. What the cut-off actually means, and what has to accompany it, is set out in our guide to low testosterone after 40.
Two laboratories, two machines, two answers
The other moving part is the measurement itself, and the guideline documents its size rather than glossing over it. Most routine total testosterone is measured by immunoassay, which is fast and high-throughput and has a published intra-assay coefficient of variation of minus 14 to plus 19 per cent.
The important detail is where that error concentrates. The variation is most pronounced at lower testosterone values, reaching 40 per cent in samples below 100 ng/dL — which is precisely the region where the result changes what happens next. The alternative, liquid chromatography with mass spectrometry, is described as the gold standard and must stay within 6.4 per cent to keep its CDC approval.
That tolerance is not a rhetorical figure. The CDC Hormone Standardization Program certifies laboratory methods for total testosterone across a concentration range of 2.50 to 1,000 ng/dL against a reference measurement, and publishes the list of methods that meet it. The harmonisation study reached the same conclusion from the other direction: a substantial proportion of the variation between cohorts was due to assay differences.
Use the same laboratory for both draws, and for any later comparison. The guideline's own diagnostic rule asks for two early-morning levels at the same laboratory using the same assay, and this is why. Comparing a result from one machine against a result from another adds a second source of movement on top of your own biology.
What “low” meant across forty studies
If the definition of low were stable, none of the above would matter much in practice. It is not, and there is a measurement of how unstable it is. A review searched the literature from 1966 to 2014 for studies that paired a clinical indication of low testosterone with an actual measurement.
Across the 40 studies that qualified, covering 37,565 men aged 43 to 82, the prevalence of low testosterone — defined as the lower normal limit of whichever assay was used — ranged from 2 to 77 per cent. Total testosterone was used in 29 of them, with thresholds spanning 200 to 433 ng/dL. Millar et al., cited in the AUA Testosterone Deficiency Guideline
Read that twice. The proportion of men found to be low ranged from one in fifty to three in four, and the largest single driver was where each study drew its own line. The AUA's own response to this mess was to pick one threshold and defend it: total testosterone below 300 ng/dL, chosen with a view to maximising potential benefit while minimising the risks of treatment.
The 300 figure is therefore best understood as a deliberate decision rather than a biological boundary. Nothing changes inside a man's body as he crosses it. What changes is the balance of expected benefit against expected risk from treating him.
How to read your own result against all of this
None of the above means the number is worthless. It means the number needs three pieces of context to be read, and all three are available to you.
- Find the collection time before the value. An afternoon draw is a different measurement, not a slightly worse one. The testosterone test covers how much difference the hour makes.
- Compare against the absolute figures, not only the printed band. 300 as the cut-off, 531 as the median of healthy young men, 264 as the bottom of the harmonised range.
- Check whether there are two results, from the same laboratory. One is a snapshot, and two from different machines are hard to compare.
- Put the symptoms next to it. The diagnosis requires both halves; which symptoms actually point at it sorts them by how much weight each carries.
- Ask for the older result if one exists. Given a decline of a few ng/dL a year, your own previous figure is often a more informative comparison than any published range.
That is what turns a printed line into an answer. If the answer comes back as yes, what treatment involves — and what has to be measured before it starts — is set out in testosterone replacement therapy: what each form does. If broken nights are the background to all of this, our sleep guide is the better place to start.
Key takeaways
- A reference range is the 5th to 95th, or 2.5th to 97.5th, percentiles of whichever population a laboratory sampled — not a standard of health.
- The harmonised range from 9,054 men in four cohorts is 264 to 916 ng/dL, with a median of 531, in healthy nonobese men aged 19 to 39.
- Restricting that sample to nonobese men raised the figures: age-specific values in nonobese men were greater than in all men taken together.
- The AUA states that definitive age-specific reference ranges do not exist, and lists the question among its future research topics.
- Followed within the same men over time, the average change was 0.124 nmol/L a year — roughly 3.6 ng/dL — with low levels in about 20 per cent of men over 60.
- A value of 250 ng/dL may be printed as normal by a laboratory and counted as low by the guideline, which tells clinicians to follow the absolute value.
- Immunoassay variation reaches 40 per cent in samples below 100 ng/dL; across 40 studies, prevalence of low testosterone ranged from 2 to 77 per cent depending on the threshold used.
Where to go from here
The number is one of three things you need. These are the other two, and what follows:
- Low Testosterone After 40: The Number and What It Means — the guide to the whole subject.
- Low Testosterone Symptoms: Which Ones Actually Point at It — the other half of the diagnosis.
- The Testosterone Test That Actually Tells You Something — how the sample has to be taken.
- Testosterone Replacement Therapy: What Each Form Does — if the answer is yes.
- PSA Levels by Age — the other number men over 40 are handed without an explanation.
Frequently asked questions
What is a normal testosterone level for a man?
The harmonised range derived from 9,054 men in four cohort studies is 264 to 916 ng/dL, measured in healthy nonobese men aged 19 to 39. The median in that group was 531 ng/dL. Separately, the AUA guideline uses a total testosterone below 300 ng/dL as a reasonable cut-off in support of a diagnosis of low testosterone.
What are normal testosterone levels by age?
There is no settled table. The AUA guideline states that definitive age-specific reference ranges do not exist, and lists it as an open research question. The widely quoted 264 to 916 range describes men aged 19 to 39 specifically, not men in their fifties or sixties.
Is 400 ng/dL a normal testosterone level?
It sits above the 300 ng/dL cut-off the AUA uses in support of a diagnosis of low testosterone, and inside the harmonised 264 to 916 range for men aged 19 to 39, though below that group's median of 531. A single number never answers this on its own: the guideline requires two early-morning measurements combined with symptoms.
Why does my lab say my testosterone is normal when it is under 300?
Because a laboratory range describes the population it sampled. The guideline gives exactly this example: a total testosterone value of 250 ng/dL may be considered low by the guideline but be marked within the normal range by the laboratory, because reference laboratories often define normal as the 5th to 95th percentiles of a sampled population.
How much does testosterone drop each year after 40?
In the Baltimore Longitudinal Study of Aging, which followed the same 890 men over time rather than comparing different age groups, the average change was 0.124 nmol per litre per year, which is roughly 3.6 ng/dL a year in the units American laboratories print. The same study found low levels in about 20 per cent of men over 60 and 30 per cent over 70.
Do different laboratories give different testosterone results?
Yes, and the size of it is documented. The harmonisation study concluded that a substantial proportion of the variation between cohorts was due to assay differences. Immunoassays carry an intra-assay coefficient of variation of minus 14 to plus 19 per cent, reaching 40 per cent in samples below 100 ng/dL, which is exactly where the decision is made.
Sources
- Travison et al., Journal of Clinical Endocrinology & Metabolism, 2017 — Harmonized Reference Ranges for Circulating Testosterone Levels in Men of Four Cohort Studies in the United States and Europe
- American Urological Association — Testosterone Deficiency Guideline (Reference Ranges, Table 4, statement 1, prevalence)
- Harman et al., Journal of Clinical Endocrinology & Metabolism, 2001 — Longitudinal Effects of Aging on Serum Total and Free Testosterone Levels (Baltimore Longitudinal Study of Aging)
- Centers for Disease Control and Prevention — Steroid Hormones Standardization Programs
- MedlinePlus (National Library of Medicine) — How to Understand Your Lab Results

Male Health Guide Editorial Team
We write about the health problems men over 40 actually search for at 3 a.m. — and we say plainly when the evidence for a popular product is thin. We do not invent credentials and we do not publish sponsored copy as editorial. Read more about how we work.
Medical disclaimer: This article is general information about how testosterone reference ranges are built and is not medical advice. It cannot interpret your own result, which has to be read by someone who can see it alongside your history, your symptoms and the method your laboratory used. Please speak to a qualified healthcare professional about your own situation.